Data Labeling for Work in Progress Reports (WIPs)
Each contractor formats their Work in Progress (WIP) reports differently . For instance, one contractor might use "Contract Price" while another uses "Contract Value" for the same concept.
To ensure reporting consistency, Boom standardizes this data by mapping each contractor's column labels to Boom's standard terminology. For example:
Contractor A's "Contract Price" → Boom's "Contract Value"
Contractor B's "Contract Value" → Boom's "Contract Value"
This mapping process relies on AI to automatically identify and link similar concepts. However, since the AI may occasionally mislabel columns while extracting data from WIPs, we recommend familiarizing yourself with Boom's data classification system so you can spot and correct any errors.
In this article, you'll learn how to verify the mapped column assignments on the WIP extraction page..
From the Company page, click into a single Work in Progress document.
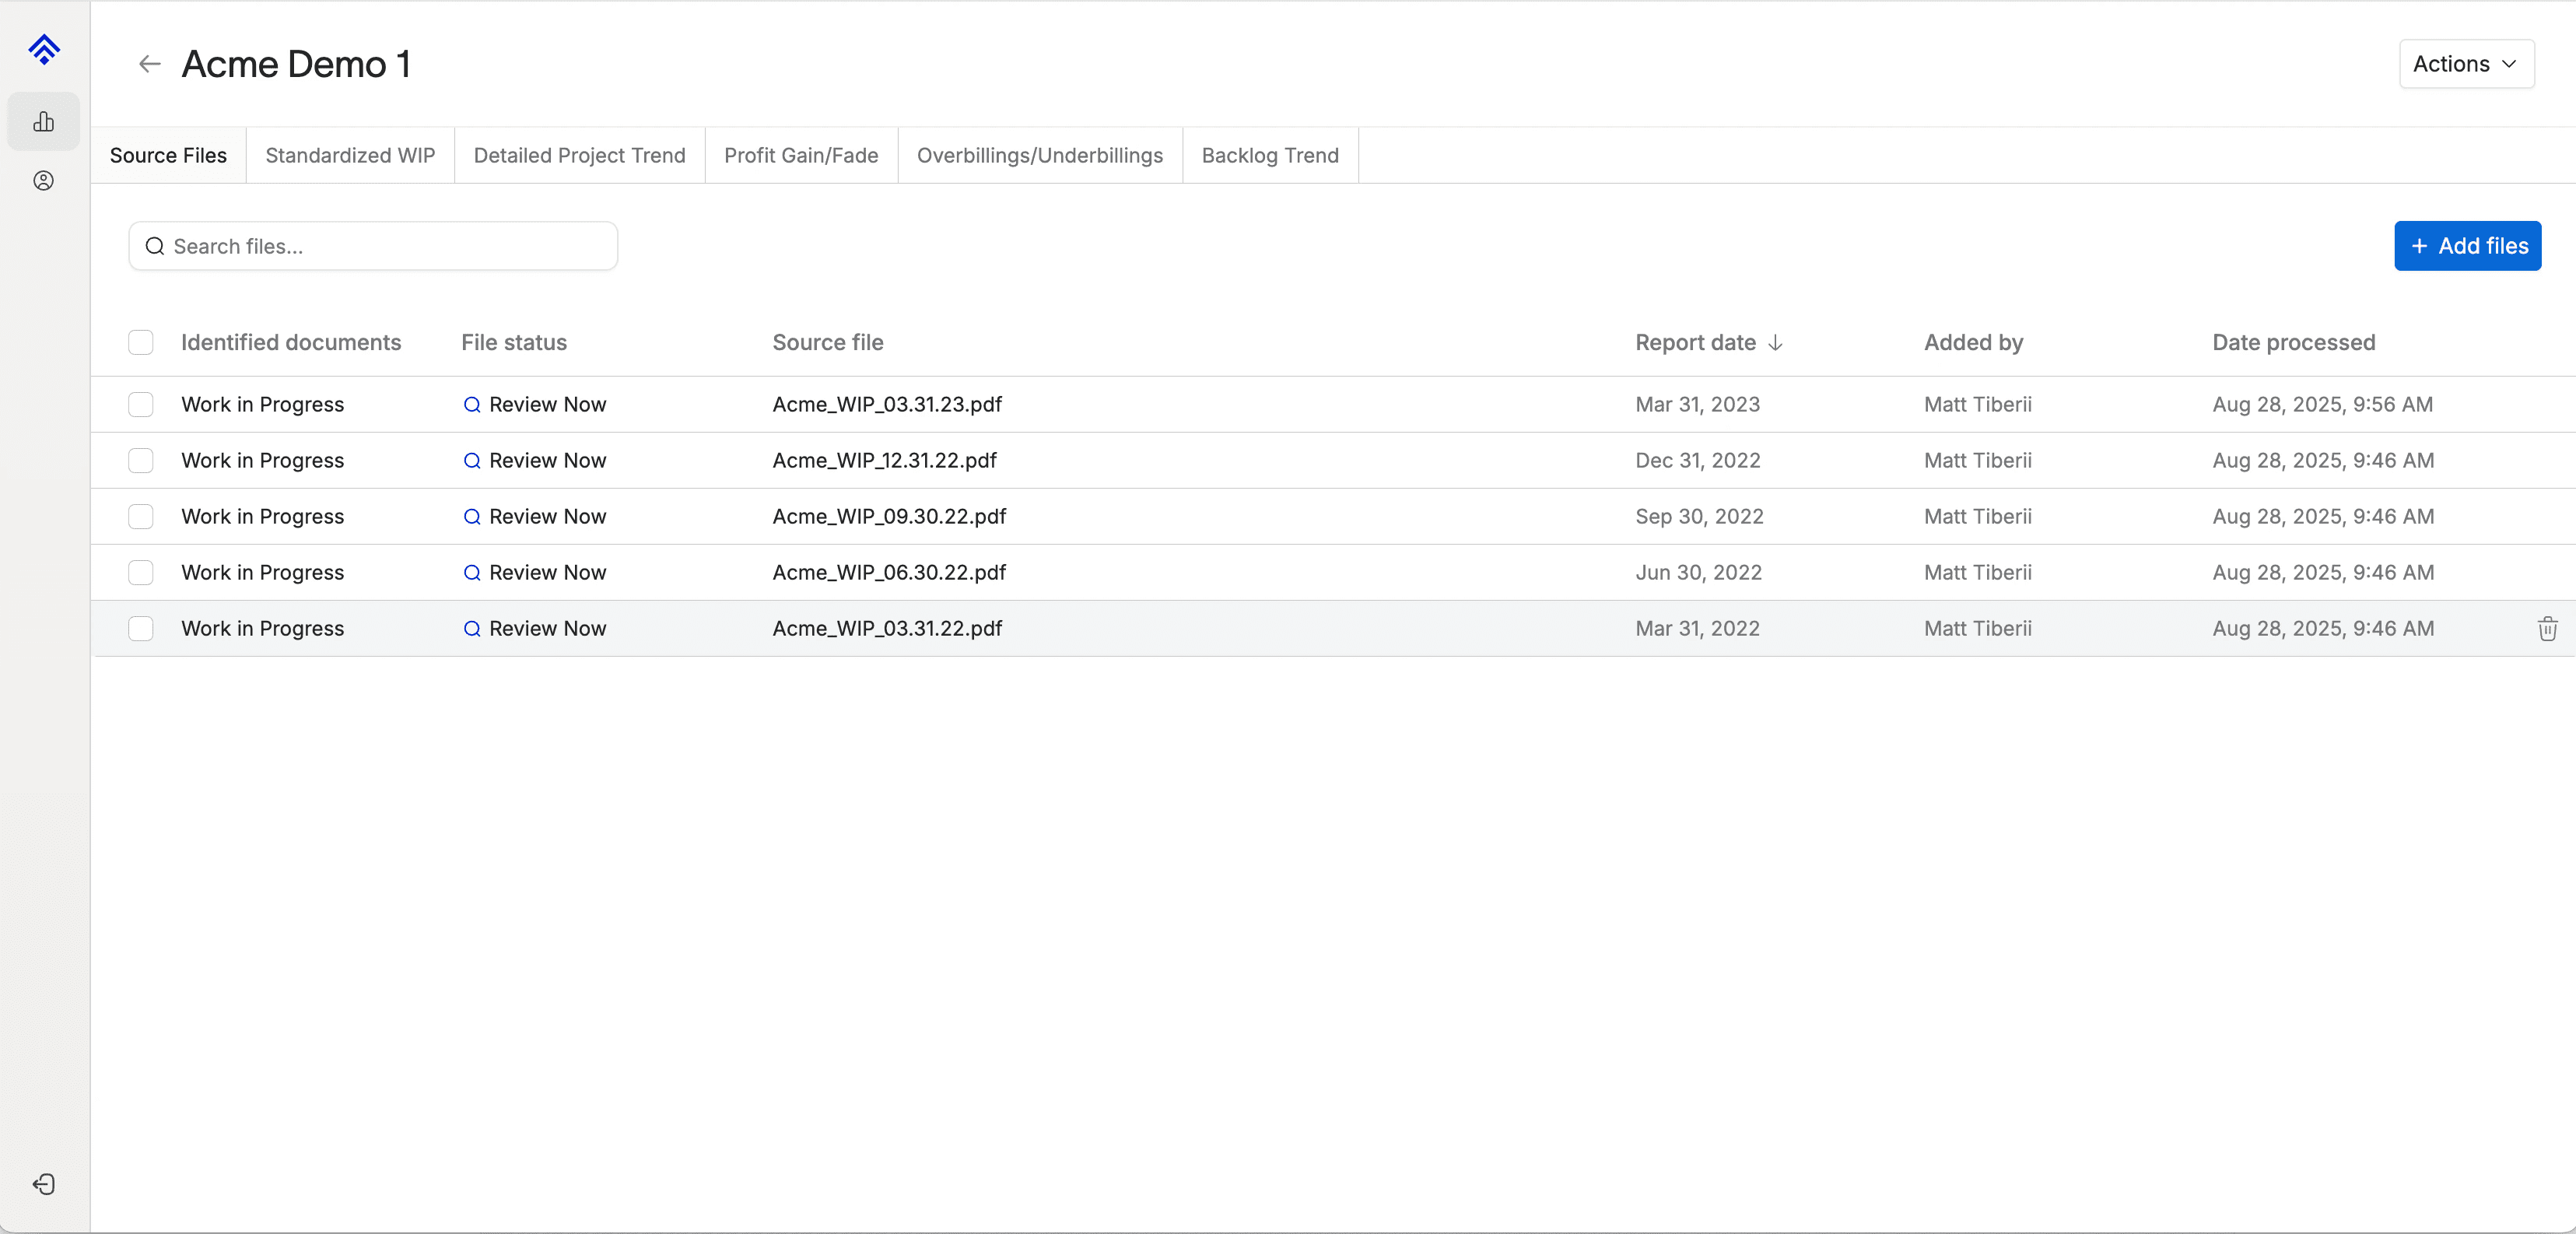
You'll land on the WIP detail page and see the project data in a grid at the top, and an image of the contractor's original WIP at the bottom.
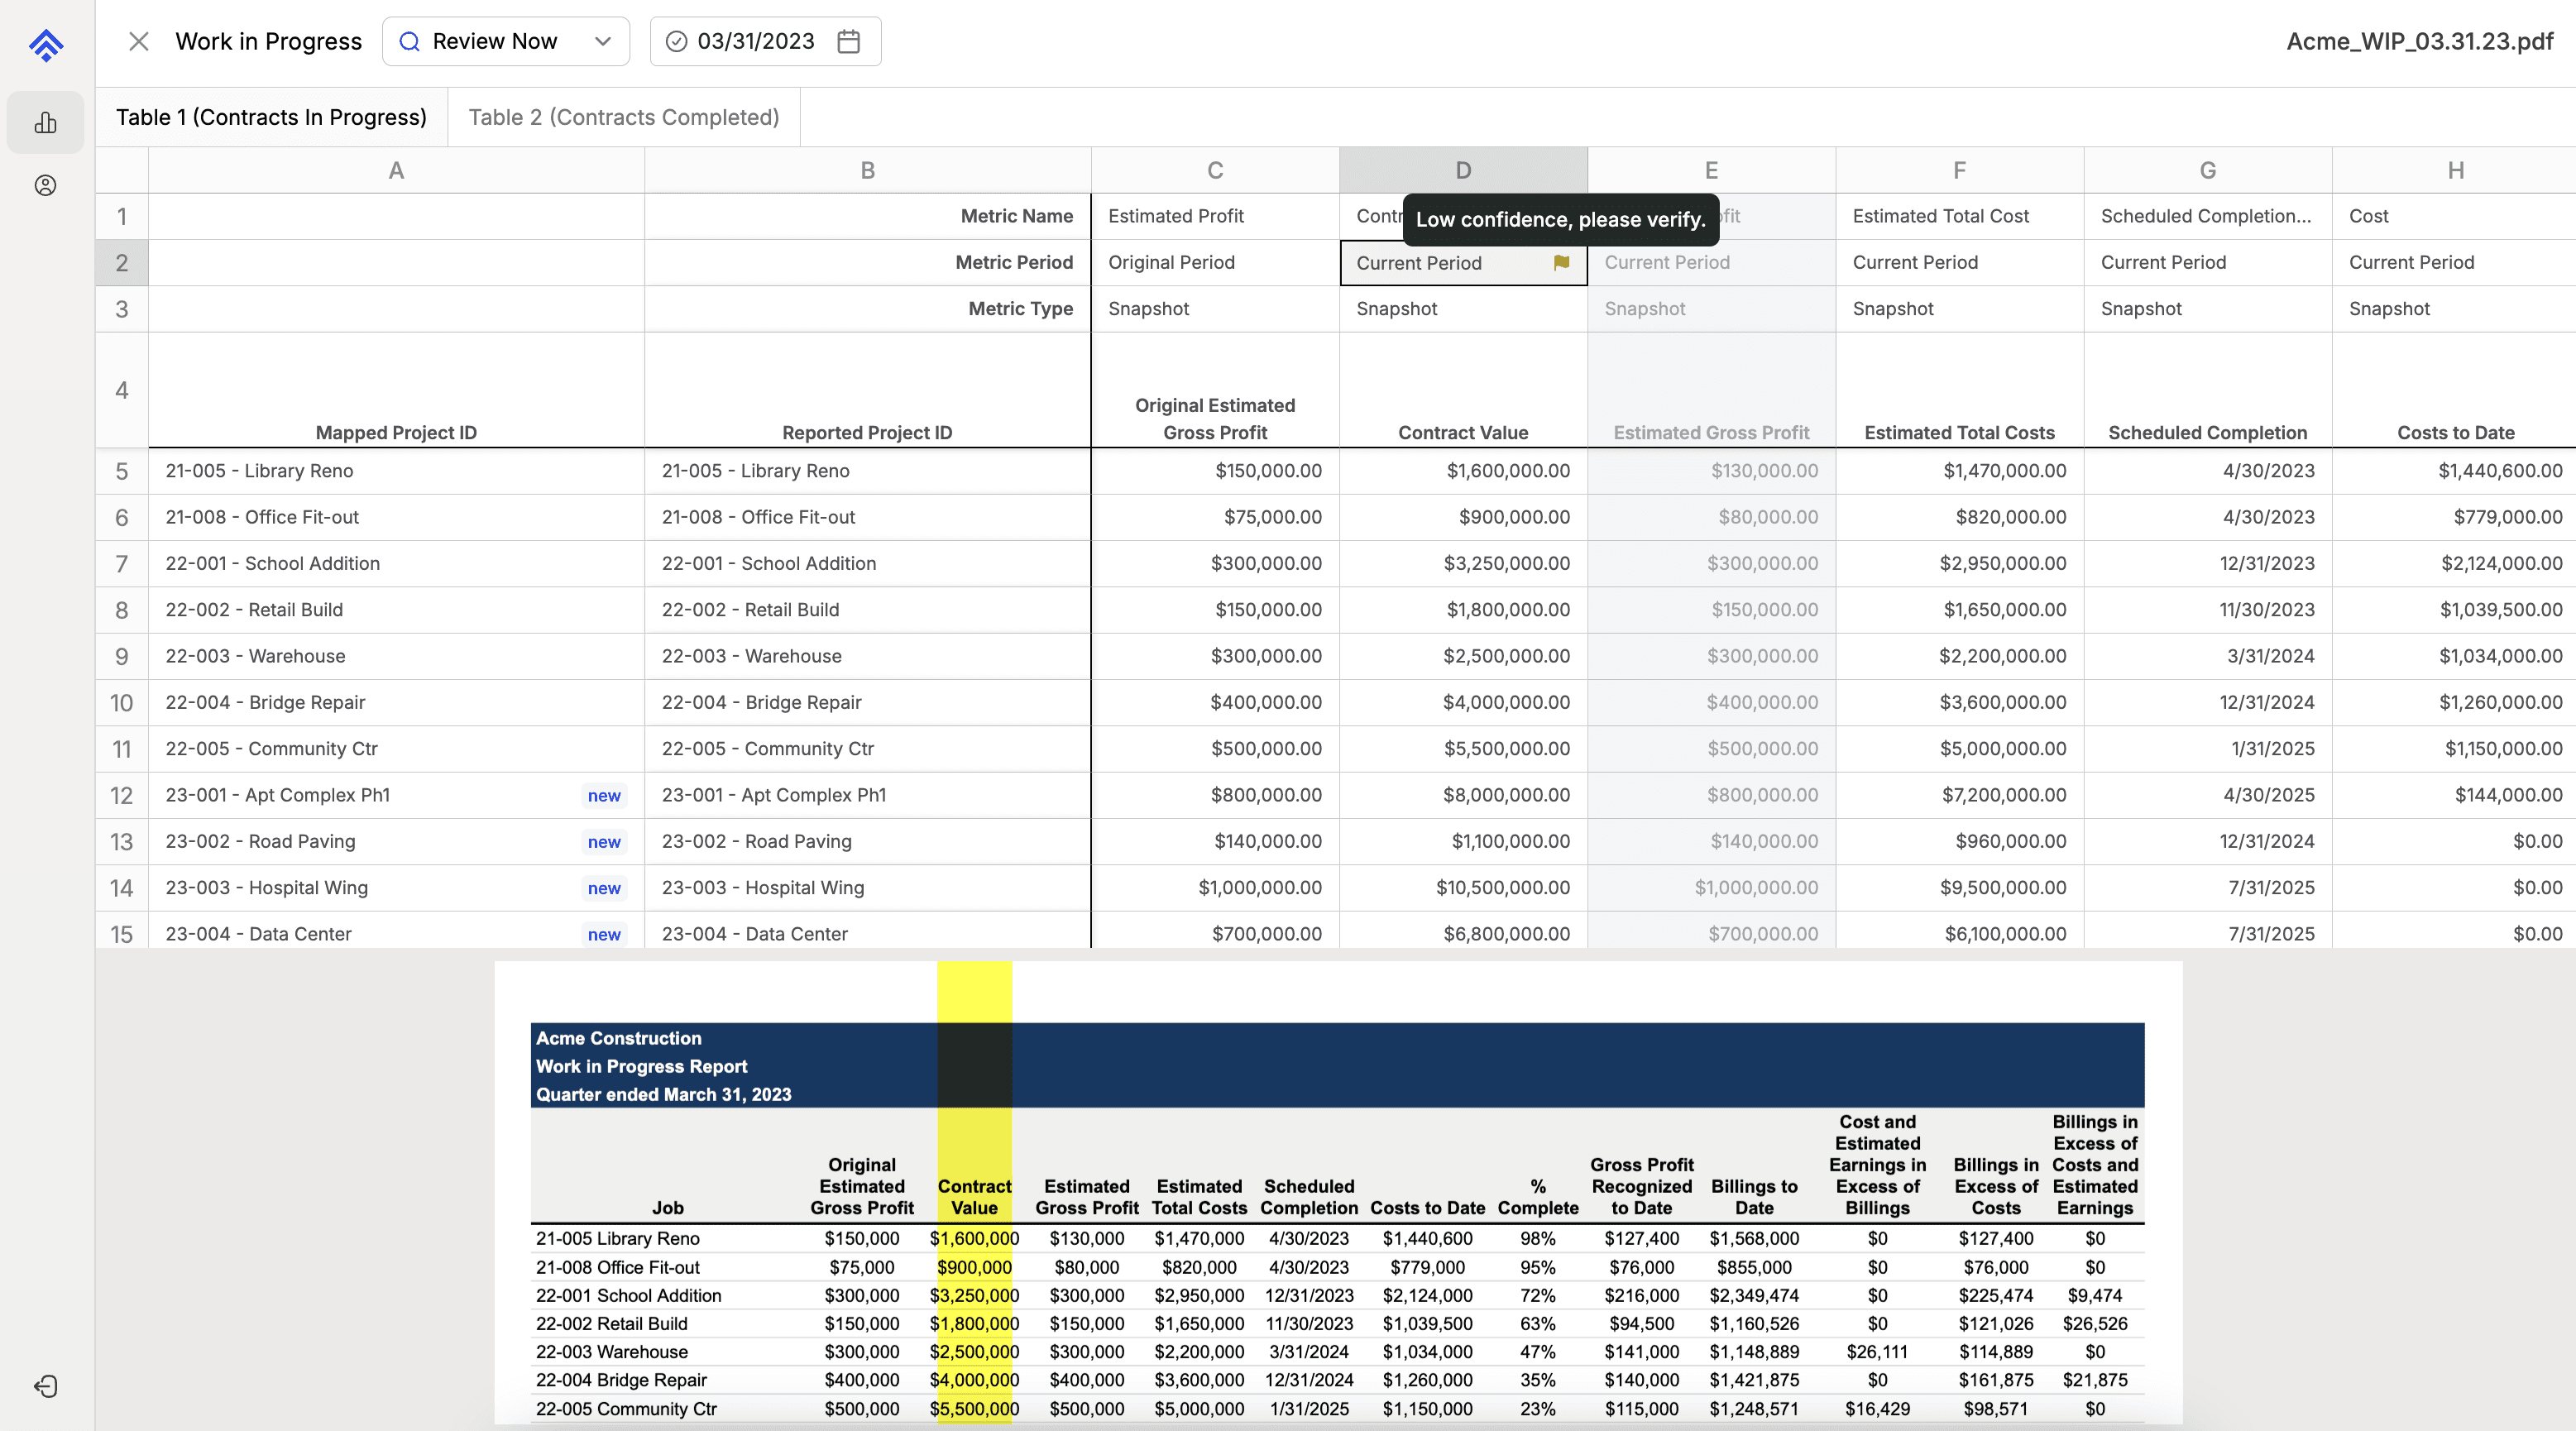
The goal is to verify that the column headers were assigned correctly by Boom. If you see a red flag, it means the AI has low confidence in the assigned classification. Note: We recommend checking each column header regardless if there's a flag or not.
There are three data labeling concepts that should be verified on a contractor WIP extraction.
The Metric Name - what is being measured (e.g., cost or profit).
The Metric Period - when it was measured (e.g., this month or at the project's start)
The Metric Type - how it was measured (e.g., a total for the month or a balance on a specific day).
To modify the label, click the cell and a dropdown of all available labeling options will display.
Select the correct label, and repeat for every column header with a white background.
Note: Boom uses the minimum amount of data from a contractor WIP (typically 4-5 columns) to calculate additional WIP metrics and build trend reports. Therefore, there's no need to verify columns with a gray background.

To help you validate column headers, we recommend becoming familiar with all the data labeling concepts below.
Metric Names
This field identifies the specific financial, operational, or progress data point for a construction project.
Billings: The total amount invoiced to the client for work performed to date.
Billings Backlog: The remaining portion of the contract value that has not yet been billed.
Change Order Amount: The total dollar value of approved changes to the original contract scope.
Change Order Percent: The Change Order Amount expressed as a percentage of the original Contract Value.
Contract Value: The total agreed-upon price for the project, including all approved change orders.
Cost: The actual, direct costs incurred on the project over a period of time
Estimated Cost to Complete: The forecasted cost required to finish all remaining work on the project.
Estimated Profit: The total anticipated profit at the end of the project, calculated as Contract Value - Estimated Total Cost.
Estimated Profit Margin: The Estimated Profit shown as a percentage of the total Contract Value.
Estimated Profit vs Original: The dollar difference between the current Estimated Profit and the profit projected in the original budget.
Estimated Profit vs Original Percent: The percentage difference between the current Estimated Profit and the original estimated profit.
Estimated Total Cost: The sum of costs incurred to date plus the Estimated Cost to Complete. This is the project's current total cost forecast.
Job Borrow: Funds borrowed internally from one project to temporarily cover costs on another; calculated as Estimated Cost to Complete - Billings Backlog > 0.
Over/Under Billings: A key WIP calculation showing the difference between revenue earned and the amount billed. This determines if you've billed for more or less work than you've completed. Usually this metric is split into 2 separate columns for Overbillings and Underbillings
Overbillings: The amount by which billings to date exceed the revenue earned to date. This is effectively a liability on the balance sheet.
Overbillings Cost Only: A specific calculation comparing billings directly to costs incurred, rather than to revenue earned. Can be compared to Profit to date to see the timing difference between when profit is billed vs. when it’s recognized.
Percent Complete: The project's progress, calculated as job-to-date Costs ÷ Estimated Total Cost.
Profit: The actual profit earned over a period of time, calculated as Revenue - Cost.
Profit Backlog: The remaining estimated profit on the uncompleted portion of the project.
Profit Backlog Margin: The Profit Backlog expressed as a percentage of the remaining revenue to be earned (Revenue Backlog).
Profit Margin: The profit earned so far as a percentage of the revenue earned so far.
Revenue: The portion of the contract value considered "earned" to date, typically calculated based on the Percent Complete method.
Revenue Backlog: The remaining portion of the contract value that has not yet been recognized as revenue.
Scheduled Completion Date: The planned or updated date for project completion.
Scheduled Start Date: The planned date for project commencement.
Underbillings: The amount by which revenue earned to date exceeds the amount billed to the client. This is an asset on the balance sheet.
Other: A miscellaneous category for any unique, company-specific metrics not listed above.
Metric Periods
This field specifies the time frame the data represents.
Current Period: Data related to the most recent reporting period (e.g., the current month).
Previous Period: Data from the period immediately preceding the current one (e.g., last month).
Original Period: The initial budget, schedule, or estimate established at the very beginning of the project.
Metric Types
This field describes how the metric is measured over time.
Snapshot: A value measured at a single, specific point in time. This represents a balance or status on a particular day (e.g., Total Cost as of August 28th).
Interval: A value measured over a duration or period of time. This represents the total activity that occurred between two dates (e.g., Billings during the month of August).